Daily Cytometer Setup using Quantum QC.
Posted: March 23, 2018
Setting PMTs to Ensure Consistent Fluorescence Measurements
Quantum QC can be used to set up PMTs for measuring consistent fluorescence intensity day to day. One, or several, of the fluorescent peaks can be monitored daily and PMT levels adusted to ensure that consistent fluorescent levels are obtained. It is a good idea to choose a peak that is close to the intensity of a typical target sample for that channel. Determination of appropriate ranges should be done by attempting to set the PMTs to a specific fluorescence target for several days. Variation should be analyzed to see what the spread in channel values are and then upper and lower limits placed on the channel targets (based either on standard deviations or fixed percentages). Data should be tracked with Levey-Jennings charts or similar. Make sure that the upper to lower range is greater than the channel value change caused by a single value PMT adjustment otherwise any adjustments might overshoot the intensity range. These measurements will be required of every fluorescence channel.
Daily Setpoint Protocol
- Step 1: Dilute blank and dyed beads at 1 drop of each in 1.6 mL of lab-use diluent and mix via vortex or tapping.
- Step 2: Set the PMT voltages for all fluorescence channels of interest to those that will result in at least one Quantum QC peak being at or near the fluorescence level of samples that are typically run.
- Step 3: Place the tube on the cytometer and run the beads, recording the lab standard number of events (typically 10,000).
- Step 4: If one or more of the recorded Quantum QC peaks are satisfactorily close to the desired fluorescence levels for that fluorescence channel, then record the PMT voltage and median fluorescence intensity measured at FWHM (full-width at half-max). If not, then adjust PMT voltages for that fluorescence channel until satisfactory results are found and record these values.
- Step 5: On the next day, repeat steps 1-4 starting at the PMT voltage used on the previous day. Adjust the PMT voltages so that the recorded values are as close as possible to the MFI recorded the previous day.
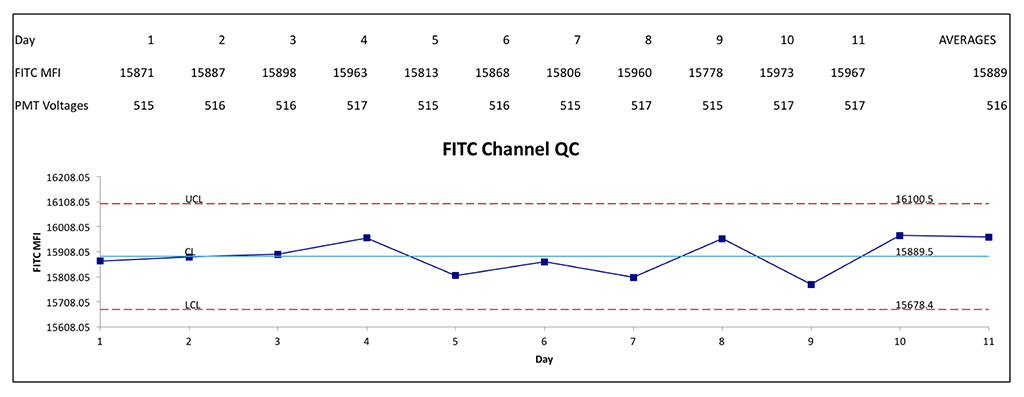
- Step 6: Repeat step 5 on subsequent days to collect enough data to establish control limits. A good general number to begin with is 11 days worth of data.
- Step 7: Control limits must be established. This choice again is up to the user, but typical limit values are 2 standard deviations or 10% +/- of the averaged median channel values. Tracking of daily values should be done with Levey-Jennings charts or equivalent for each fluorescence channel. Ensure that the control limit range is not less than the MFI per PMT voltage change, as this could make it difficult to set the PMT for that fluorescence channel.