Quantum QC for Daily Cytometer QC
Posted: January 30, 2017
As many a cytometrist can attest, flow cytometers are fickle beasts. Changes in laser output, filter efficiency, PMTs, flow pressure/rate, etc., are all possible, and can impact results. Furthermore, changes in the lab environment, such as humidity, temperature, and vibrations can also affect readings. With so much possible variability, what is a user to do?!
Thankfully, the best way to combat variation is to get a good idea of what is considered “normal” for the instrument. After all, it’s hard to say that something is abnormal, if you don’t have an understanding of what normal is. This can be accomplished by taking daily measurements using our Quantum QC 8 Peak Beads, which are multi-fluorescent and feature multiple intensities.
By running the beads in various channels at set daily PMTs, the daily median fluorescence value of designated peaks can be obtained, and recorded in a spreadsheet. From there this dataset can be used to generate a run chart, allowing users to set tolerance values (e.g. 3 standard deviations) above/below the mean, that if violated may indicate a problem. The run chart will also allow easy identification of gradual trends, which allows for treatment of issues before they would violate the absolute tolerances.
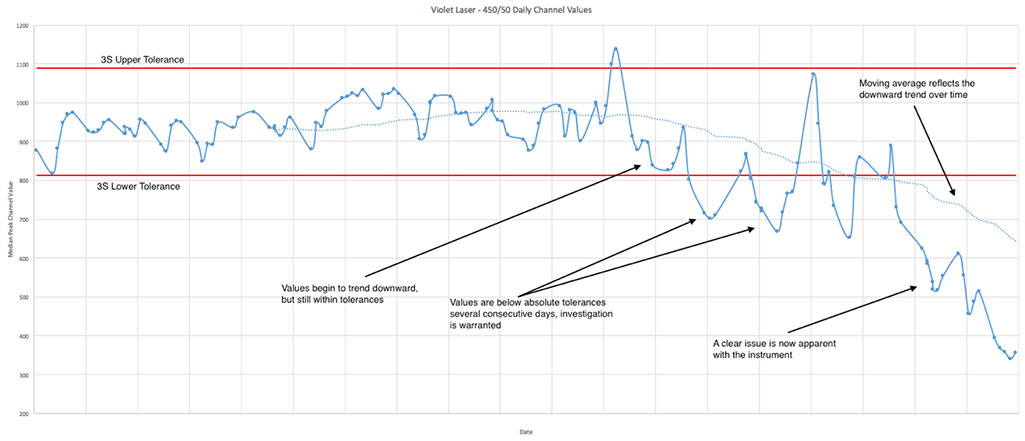
The below figure illustrates the daily QC of a 405 nm laser in the blue channel (450/50 BP) on an LSRII. Channel values for the designated Quantum QC peak began to decrease over a few weeks’ time, and a definitive failure is confirmed the next month. A subsequent service visit indicated poor laser output and the need for a new laser.